
Dataloggers Demystified: An Updated Guide to Environmental Monitoring
Temperature, relative humidity, and light—oh my! Setting up a sustainable environmental monitoring program can feel scary enough—when you add in the confusing world of dataloggers and software, the whole thing can be overwhelming. Our goal with this updated chart is to ease some of the confusion involved with selecting a datalogger that works for your needs and your budget.
This chart is not comprehensive; rather, it is a carefully selected group of options that are available at a relatively low price. Prices for consumer goods have risen since the first version was published in 2019, and we’ve included some new options to account for a wider range of budgets.
In addition to some new dataloggers, you may also notice some new data: the “accuracy” column is now “accuracy & resolution.” You can read more about the difference between range, accuracy, and resolution (and how they relate to each other) below.
Range: the highest and lowest temperature and relative humidity levels that the datalogger can read. Some manufacturers will also include the device’s operational range, which refers to the conditions to which the datalogger can be safely exposed and is often much wider than the reading range.
Resolution: the increments the logger uses to collect data. In other words, how specific the readings are – the smaller the resolution value, the more specific the data.
Accuracy: how close the measurements are to the true temperature and/or relative humidity.
These considerations, plus the others recorded on the chart, are a good starting point. Other things to look for as you compare options include the logging interval (how often the logger takes readings), transmission range (at what distance you can retrieve data remotely), drift or stability (the rate at which readings may reduce in accuracy each year), and memory capability. Users should also research each logger’s calibration needs, as some manufacturers offer free routine calibration to reduce drift.
Watch the video below for a full walkthrough of the chart. Contact us at pso@ccaha.org with any questions or suggested additions.
Happy logging!
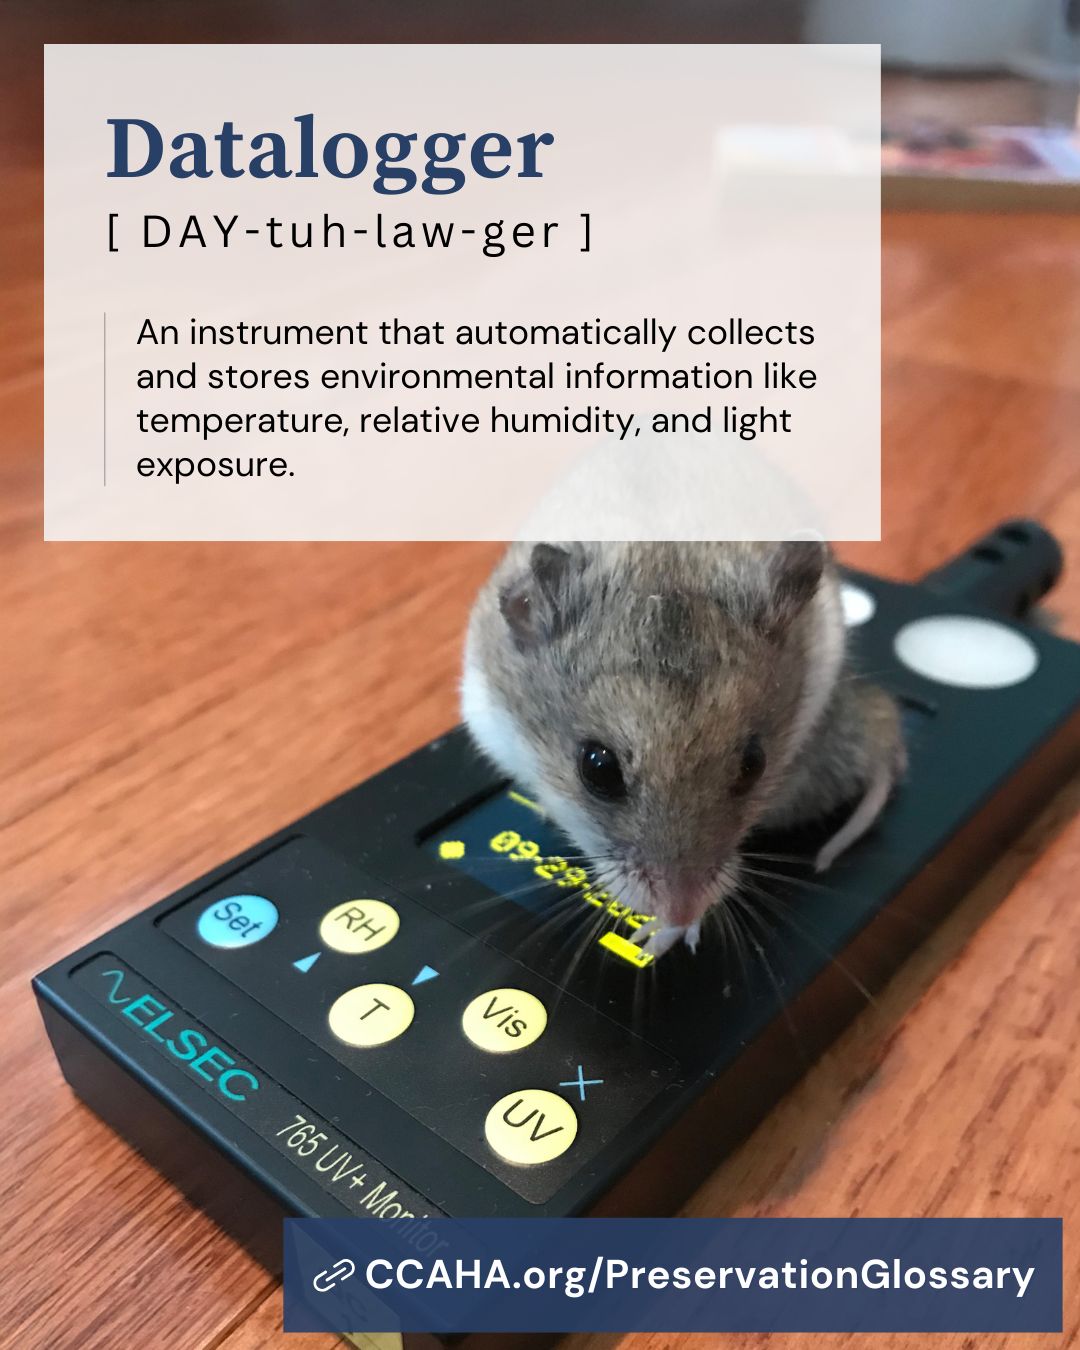
Top Image: Popcorn the hamster, quarantine co-worker of CCAHA Director of Preservation Services Dyani Feige, showing off an ELSEC datalogger used in CCAHA preservation surveys and assessments.